Original content adapted from presentation slides to better fit this medium.
Quick Context

The UWV coordinates the distribution of almost 20 billion euro spread over 600.000 clients annually.
All forms of interaction are to move from paper and telephone to digital-first.
(semi-) governmental, this means;
- Profit, Purchases, CR, CLTV or growth are not success metrics
- Primary KPI’s are customer satisfaction (CSat) and UX focused
#1 KPI –> “CSat” (customer satisfaction)
A costly, extensive, outsourced 62 item questionnaire performed twice a year by an external vendor.
CSat is used for:
– internal evaluation and monitoring of progress
– a hard target for performance set by dutch parliament
Project Goals
1. Increase the cadence of CSat KPI without increasing costs
2. Make the CSat KPI usable as OEC for website optimization
(e.g. as guard rail metric for A/B testing)
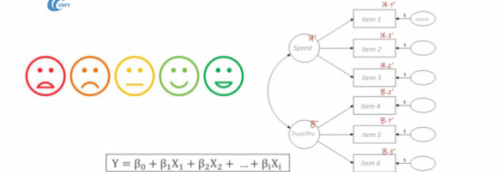
3. Improve our understanding of customer satisfaction changes in relation to the dimension underlying customer satisfaction
Planning & Collaboration
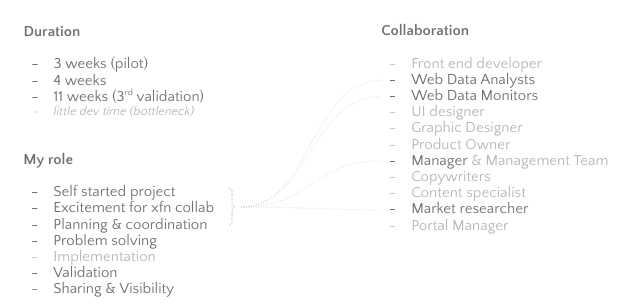
The main challenge
Limiting loss when reducing 62 items to a maximum of 8*
“How to pick the most ‘valuable’ items?”
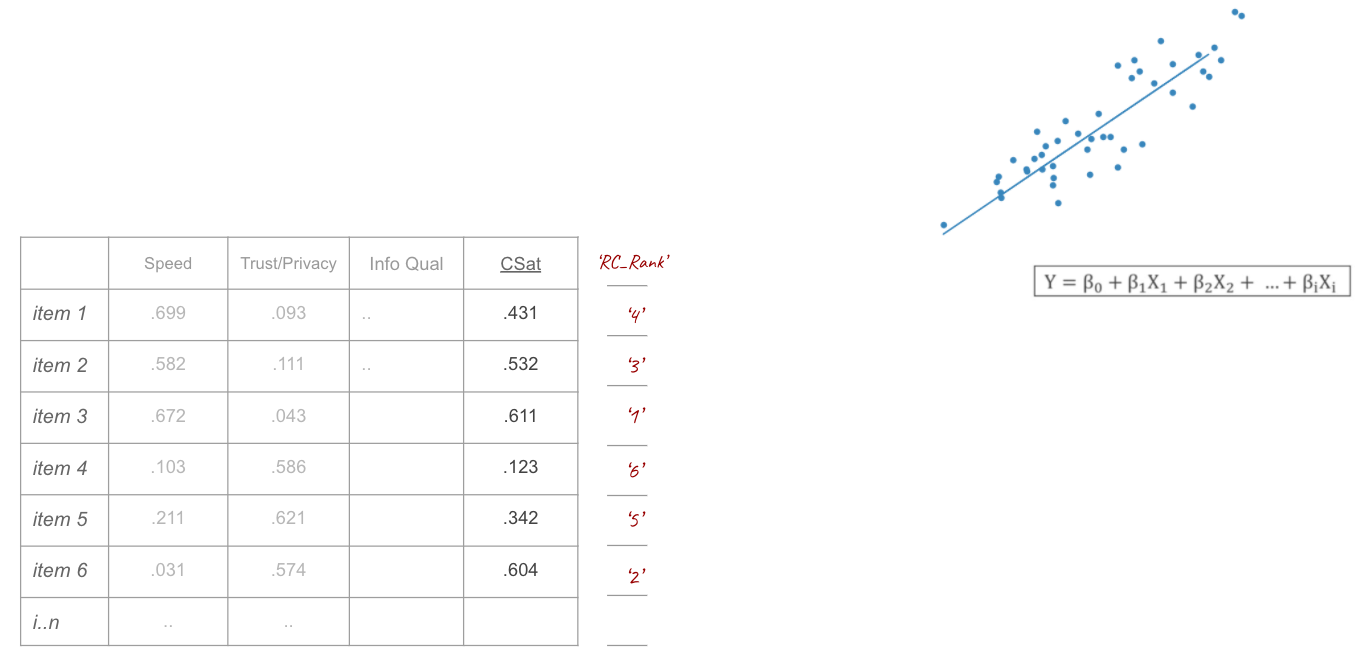
1. Exploratory factor analysis 
- first I identified dimensions underlying CSat
- within each dimension I ranked items based on factor loading
- finally I reduced dimensions based on explained variance
2. Multiple linear regression (with CSat score as dep. var)
- I ranked items based on regression coefficient
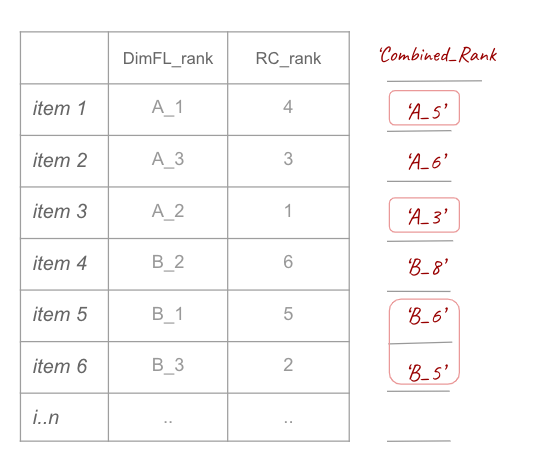
3. Reduce total items
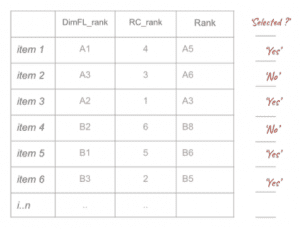
- I selected items based on combined rank scores from step 1 and 2
4. Validation & (pilot) Implementation
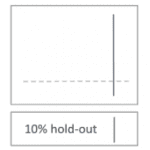
- I used a 10% fold (hold-out from step 2) to validate the regression model
- I compared ‘predicted’ CSat (from new data) against new CSat scores from the full survey
- I performed a final sanity check using a temporary surveyed single item CSat score
Limiting loss in item reduction (in practice)
Picking the ‘most valuable’ items & remodelling
Step 1: Exploratory factor analysis
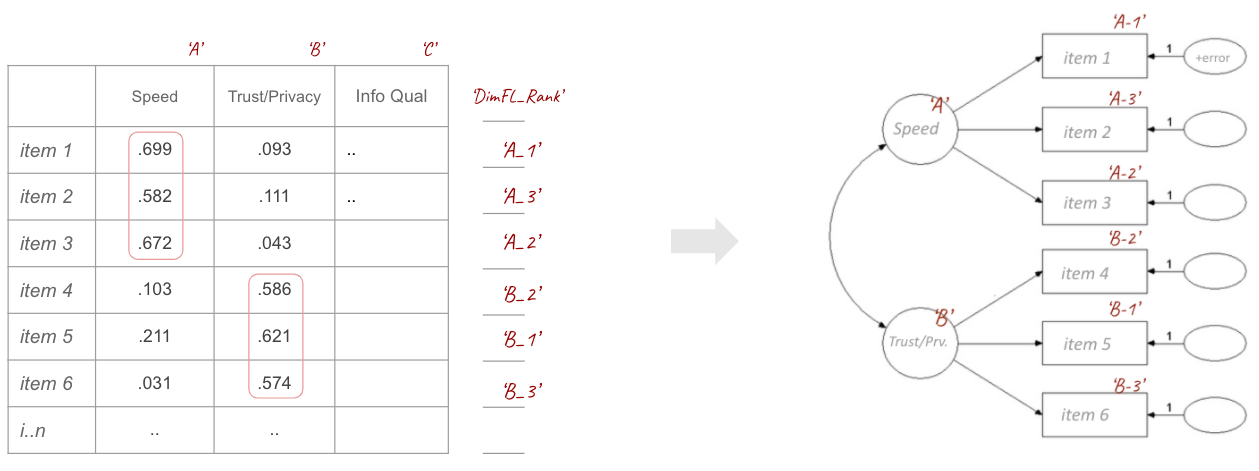
a) I identified dimensions underlying CSat using EFA
& b) secondly, I ranked items based on factor loadings
c) now I reduced dimensions based on eigenvalues (variance explained by the dimension)
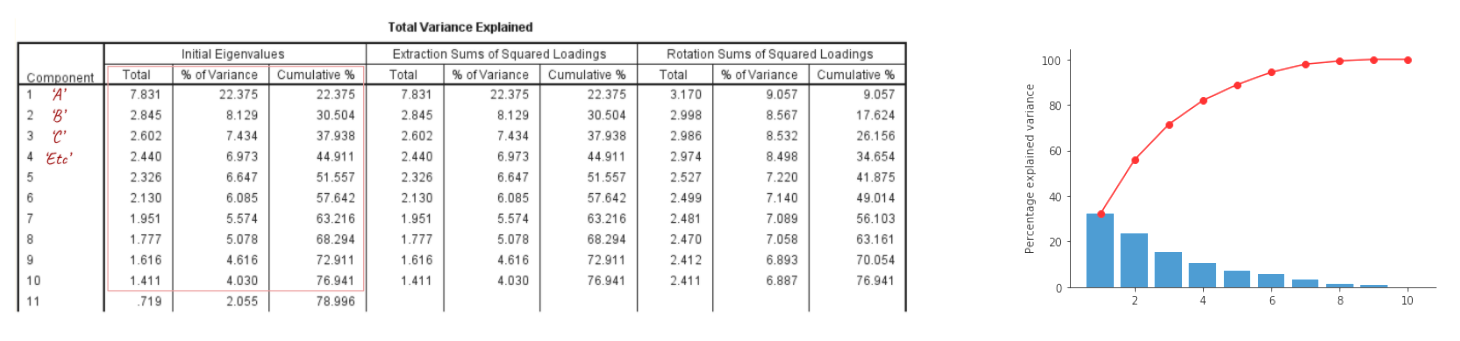
To decide on the the amount of dimensions there are two criteria commonly used. The Kaiser criterion, and Cattel’s point of inflexion. The kaiser criterion suggest retaining each dimension that has a eigenvalue greater than 1. Cattel’s point of inflexion is done by looking at the scree plot of the eigenvalues and finding the inflexion point (the point were the slope changes from negative to something close to zero (i.e. where the line flattens out). This last criterion is more subjective, but in my opinion this enables you to take into account the diminishing returns of added dimensions more easily.
Step 2: Linear Regression (with CSat score as dep. var)
As second step I ranked individual items based on their regression coefficient with CSat score
Reducing items
Here I selected items based on the combined ranking from the previous steps
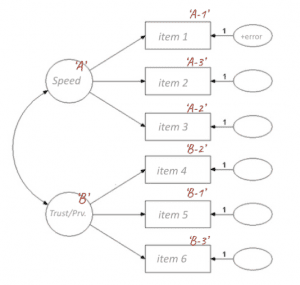
Finalizing
As we now have our selected dimensions as well as the selected items per each dimension, we can use this to cleanly model a linear regression on our data (the selected items) with the CSat scores as our dependent variable. The resulting model can now be used to estimate our CSat from our simple and short instrument.
This now gives us the ability to:
- use customer satisfaction (estimates) as a guard rail metric in A/B tests and OEC for optimization,
- track sudden crashes in customer satisfaction on a weekly basis instead biannualy
- analyse changes in CSat by underlying dimension, as well as by actual online activity of the user
Validation
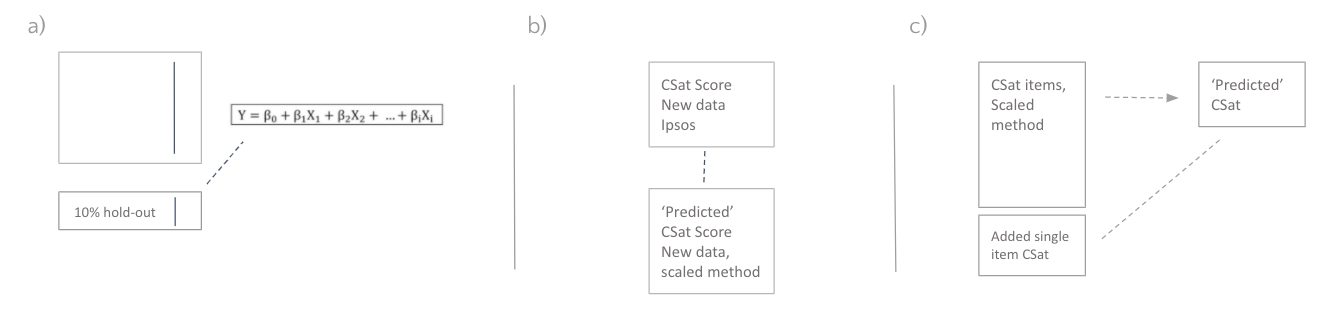
a) I validated the foundations by using the 10% holdout, running this through the regression model and comparing the ‘predicted’ CSat score with that of the external vendor’s.
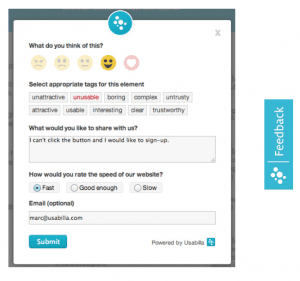
b) After this I started (pilot) implementation using Usabilla VoC tooling (currently ‘GetFeedback’), this let me compare the ‘predicted’ CSat scores of new data against new CSat scores coming from the original 62 item instrument.
c) A third and optional check* can be performed by adding a 9th item, a 10 point scale item surveying overall satisfaction and comparing this with the models predicted CSat score.
(will contain error as a fuzzy, multidimensional construct like overall customer satisfaction simply cannot reliably be measured through a single item construct, but can be valuable as an easy to communicate sanity check)
Implementation
- Usabilla (front end)
- A/B test
- type
- progress bar
- button
(response rate and attrition)
- 3% random sample (spread over 7 days)
Impact
- predicted CSat score with 97% precision
- 42% increased response rate
- 65% lower attrition
- provided granularity and link to logged on-site behavior
- underlying dimension of (changes in) customer satisfaction
- differentiate customer journeys based on onsite behavior (cohorts & segments)
- added value as optional guard rail metrics for larger A/B tests
- no more CSat surprises for management & xfn after 6 months of ‘blind optimization’
- Implemented as ‘hero KPI’ on UWV’s Management Dashboard
- Implemented as KPI on the optimization department’s 24/7 live dashboard
Closing notes
My concrete learnings and improvements to be made
- A/B test your surveys!
- Mistakes & learnings;
- communicating aspects such as validity -> keep your audience in mind
- plan carefully and share progress and planning frequently
- In the future it might be interesting to compare with an approach using second order factor analysis (structural model).
- communicating aspects such as validity -> keep your audience in mind
All values and numbers used here are fictional out of confidentiality considerations.