There are a lot of different statistical tests -also referred to as ‘hypothesis or significance tests’- to test your hypothesis. There are even more lengthy articles written about when to use which one..
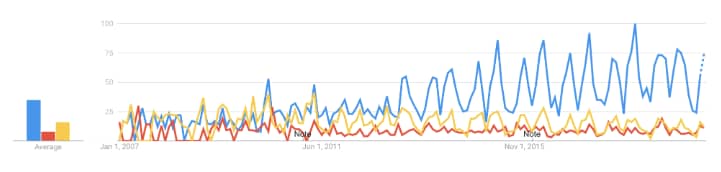
Whether you look at google trends, amount of crossvalidated ( < stackexchange) questions, datasciencecentral posts or or just sheer amount of articles/blogs published, all point to a strong (and growing) demand for getting this question answered.
Looking at some of these articles, they share how “which statistical test is appropriate” entirely depends on a lot of factors from your research design. So all hope of quickly finding an answer specific to your project evaporates reading just the introduction. Skim-reading on it gets even worse, as you notice each of 20+ tests takes about a full page of summarizing how each test works and what the relevant variables are for when, and only when, to use this specific test.
This neither answers the question of which specific statistical test your research project requires nor is it easily searchable based on your research design.
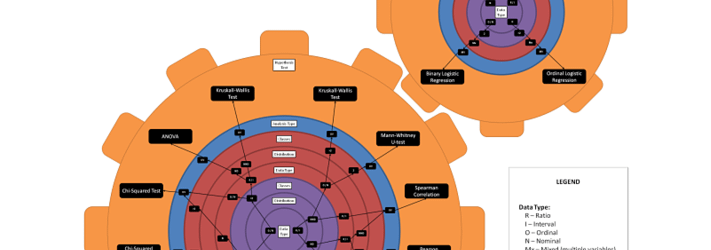
Despite these shortcomings, universities, blogs and statistical software companies (links below) keep adding articles and guides to the growing pile. All using the same lengthy, ‘one-size-fits-all’ format. I do want to give a special mention to one of these articles that imho is actually doing a good job at explaining this, which is called ‘the wheel chart’ created by Lee Baker. The chart can be found in his article on datasciencecentral.
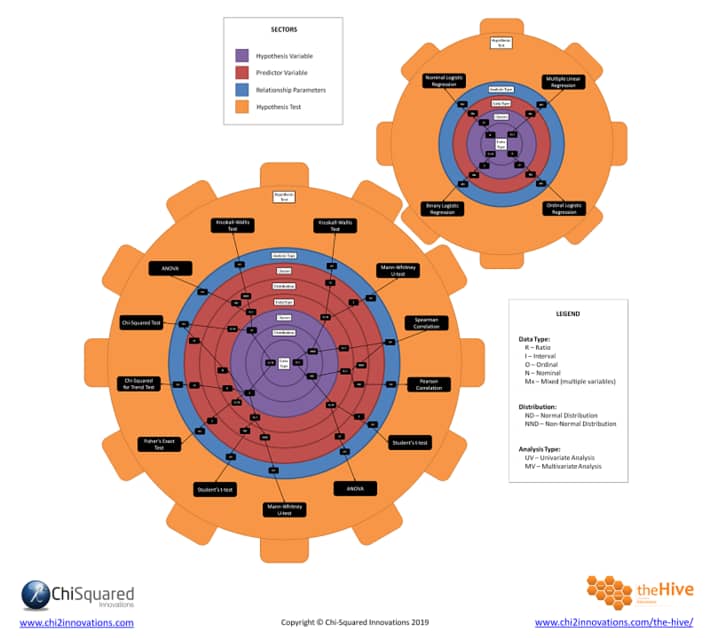
Here the most common 17 hypothesis tests are visualized as the result of differences in variables from your research design and data types/scales. The article has all other steps and accompanying trees and questions for those interested (might be worth bookmarking!).
This was by far the best I came across online, but even with this chart it is a quite cognitively taxing process, and just difficult, to find out which test to use for your specific research design. Scrolling back and forth from questions to abbreviated answers in the chart, making sure you don’t slip up one to the right or left. While only having the most common 17 tests as options.
I thought it should be doable to make this faster, easier and more ‘user-friendly’.
Reading through some of these articles myself quite frequently to check whether I am correct in choosing a Kruskal-Wallis test over a one-way independent ANOVA (*1) , or to just look up whether loglinear analysis is more appropriate than logistic regression for my project (*2), I thought it should be doable to make this faster, easier and more ‘user-friendly’
(For anyone who hates unanswered questions like the ones mentioned above, I have put the answers for these exact examples (*1 and *2) underneath this article)
UX principles, github (and some javascript) to the rescue!
To be done with reading through lengthy articles about all the minutia variable detail that determines which test to use, I decided a little while back to create a simple tool that decides which statistical test to use for your specific research design and datatypes.
How, what & where?
I turned all determinants into questions with corresponding multiple choice answers. Each answered questions eliminates some statistical test and some further determinants (questions) that have become irrelevant.
This resulted in a simple interactive tool with 7 questions (or maximum of 7 questions to be more precise) which then rolls out the appropriate statistical (hypothesis) test(s) for your specific research design and data types/scales:
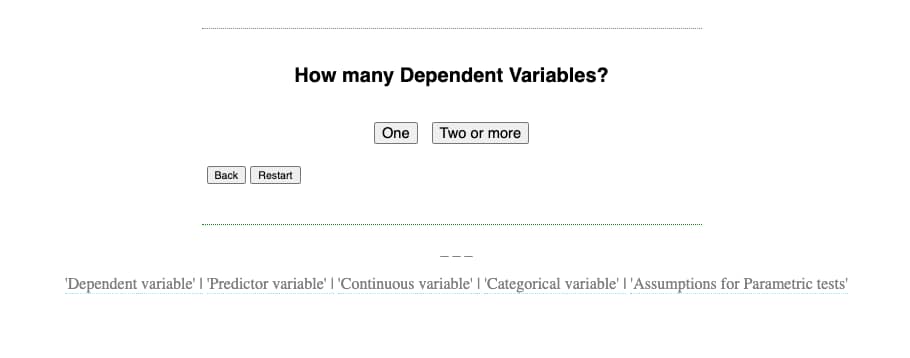
This tool works within your browser -no download required- and can be run from here: https://stevenpeutz.github.io
Happy hypothesis testing!
—- – –
This tool is of course free and open source 🙂 Source code and decision tree can be found on this github repo: github.com/stevenpeutz
—- – –
The answer to the two example questions (*1 and *2) posed above:
*1: choose Kruskal-Wallis over ANOVA if the data is non-parametric
*2: choose log linear analysis over logistic regression when all variables are categorical. (Another difference following from this is it that log linear analysis works for all combinations of predictor and outcome variable (i.e. a predefined directionality is not required) whereas in logistic regression purely from the modelling perspective we need to specify a direction (i.e. set (one of) the categorical variable(s) as dependent variable).
—- – –
Related Articles & Sources
https://trends.google.com/trends/explore?date=2007-01-01%202019-10-27&geo=US
https://stats.stackexchange.com/
https://stats.idre.ucla.edu/other/mult-pkg/whatstat/
https://towardsdatascience.com/statistical-tests-when-to-use-which-704557554740
https://www.datasciencecentral.com/profiles/blogs/statistical-hypothesis-testing-spinning-the-wheel
https://blog.minitab.com/blog/understanding-statistics/what-statistical-hypothesis-test-should-i-use